


Analysis of the dynamics of debt changes
Analyze the dynamics of debt will allow a graph showing the structure of the debt by prescription in months. The basic scale of the structure (up to 6 months, 6 to 12, 13 to 24, 25 to 36 and over 36 months) can be expanded and flexibly adjusted depending on the willingness and ability of the enterprise to create and maintain a separate processing method for this debt.
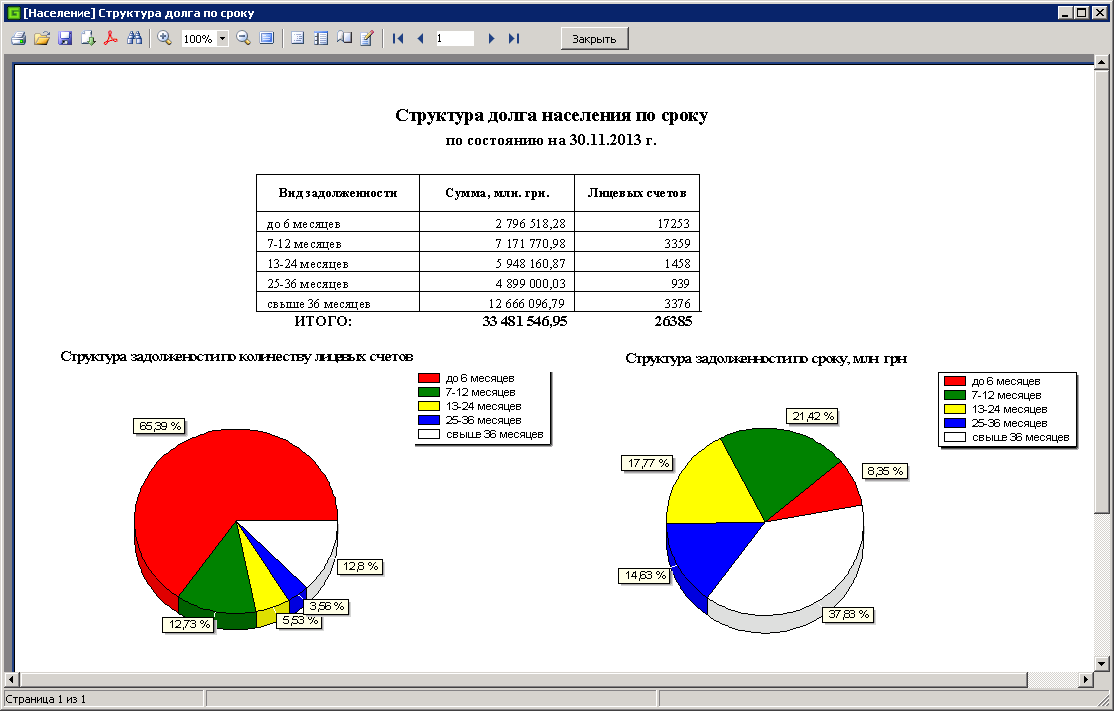
Based on the data of this graph, you can find out the average nature of delay (delay) of payments in order to analyze their reasons. Comparing such graphs for different periods of time, one can judge the effectiveness of working with debtors. For example, with effective judicial work, a debt with a limitation of 24-36 months should decrease faster than current debts.
The form of the presentation of the graph is the dependence of the present amount of the debt on the time of occurrence of the debt. As a rule, the most interesting are the current debts (up to 3 months), debts on the verge of the limitation period (34-36 months) and debts that cannot be recovered in court (more than 36 months).